How It Works
Add your tickers.
The dashboard does the maths.
When you're tracking dozens of positions across stocks and crypto, you need something that tells you which ones to look at this week. Add the tickers you care about, configure your own signal thresholds, and the dashboard handles the rest.
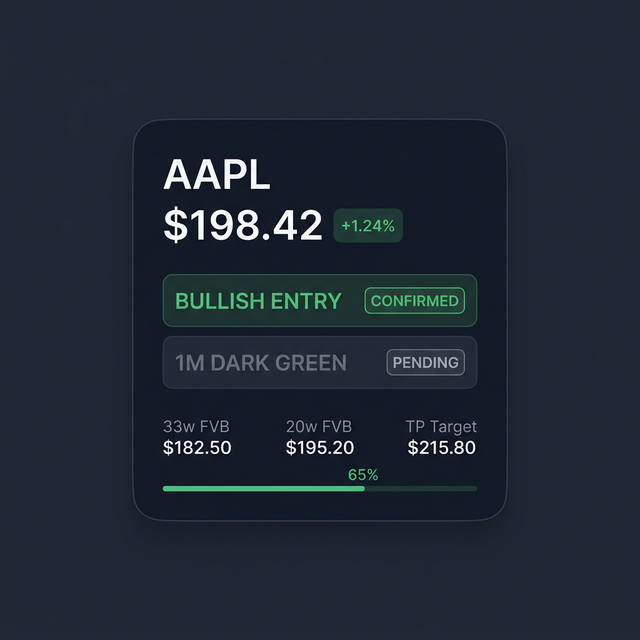
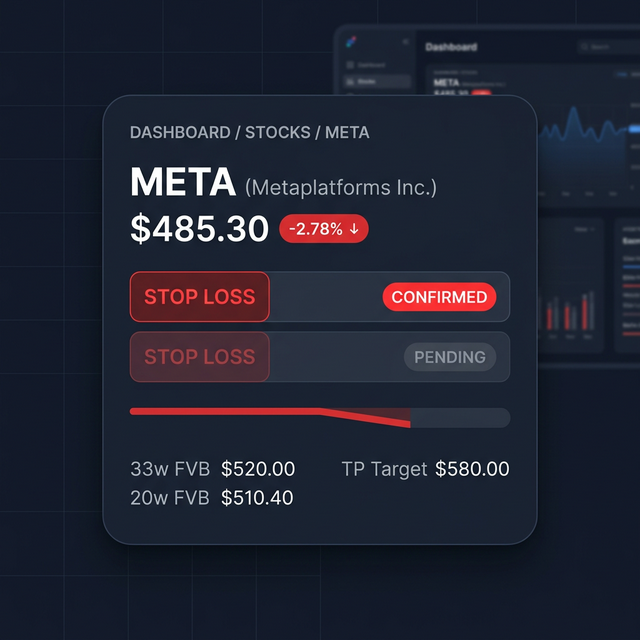
Trend Status Labels
Each ticker you add displays a status label based on publicly available monthly trend data and mathematical calculations. These are data readouts, not trade recommendations.
- ● Bullish entry and re-entry zones
- ● Take profit proximity readings
- ● Stop loss and bearish rotation flags
Strategy Presets & Indicators
Choose how the dashboard generates signals. Pick a preset strategy or configure everything manually. Each preset uses a different combination of four built-in indicators:
- ● FVB (Fair Value Bands) for entry zones and targets
- ● BX (Momentum) for monthly trend direction
- ● RSI for overbought and oversold readings
- ● EMA Cross for golden and death cross detection
Stocks, Crypto & Portfolio
Manage stocks and digital assets side by side, each in their own section. Add and remove tickers as you like. Everything is manual entry, nothing pre-loaded.
The Portfolio Tracker lets you monitor your full allocation across stocks, crypto, ETFs, NFTs, and savings with live prices, allocation charts, and a built-in retirement calculator.
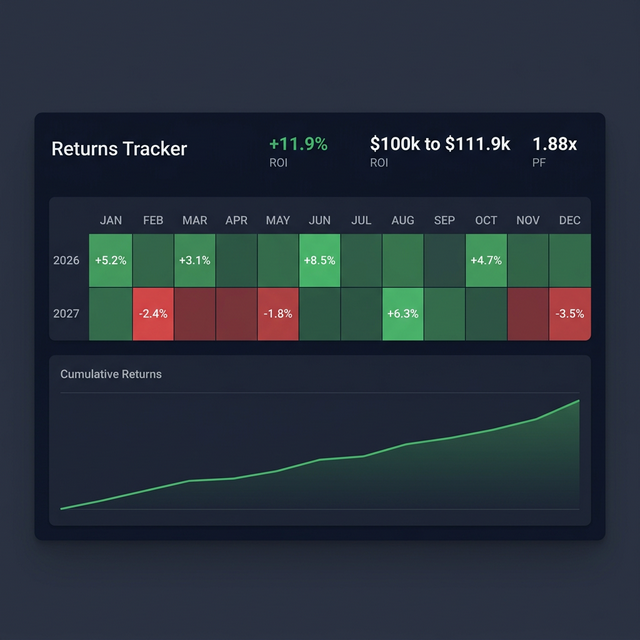
The Returns Tracker lets you log your own monthly PnL and view heatmaps, consistency stats, and cumulative performance over time.
Start organising your positions
Add your tickers and start tracking. No account needed.
Open Dashboard