A personal tracking tool built on top of third-party indicators like MBX, RSI, Fair Value Bands and EMA Cross. It does the maths so you don't have to.
This isn't a signal service or trade caller. It's a position management tool that applies public indicators to whatever tickers you add.
Strategy Presets
When you first set up, you choose one of three presets, or go fully custom. Each preset uses a different combination of indicators to generate signals.
| Strategy | How it works |
|---|---|
| Mean Reversion | Uses FVB + RSI. Enter when price is undervalued by both measures, exit when it returns to fair value. The broadest, most universally useful preset. |
| Momentum Trend | Uses BX + EMA Cross. Trend-following - enter only when momentum and trend direction agree. A completely different philosophy from mean reversion. |
| Full Confluence | All four indicators active with wider thresholds. FVB, BX, and RSI gate entry signals while EMA appears as an informational badge on tiles. Fewer signals, higher conviction. |
| Custom | Toggle any combination of FVB, BX, RSI, and EMA on or off. Full control over every indicator and threshold. The config page adapts to show only the settings relevant to your chosen indicators. |
Built-In Indicators
| Indicator | What it does |
|---|---|
| FVB | Fair Value Bands - moving average bands that define "fair value" zones. Two configurable periods (default 33w and 20w). Used for entry zones and TP targets. |
| BX | Monthly/Weekly momentum oscillator. Four colour states from bullish (green) to bearish (dark red). Drives the colour labels on tiles. |
| RSI | Relative Strength Index on weekly candles. Configurable period (14/21/28). Shows as a compact badge on tiles. Green when oversold (<30), red when overbought (>70). |
| EMA | EMA Cross - detects golden cross (bullish, 50 above 200) and death cross (bearish). Shows as EMA ▲ or EMA ▼ on tiles. Adapts automatically for crypto with limited history. |
Signal Labels
These come from monthly trend data. Each tile shows two rows: pending (top, current month, still cooking) and confirmed (bottom, last closed month, set in stone).
| Label | What it means |
|---|---|
| Bullish Entry | Your active indicators agree that conditions are favourable for an entry. The specific conditions depend on your strategy and configuration. |
| Bullish Re-Entry | Similar conditions to Bullish Entry, but triggered by a pullback into a tighter zone. An opportunity to re-enter after a previous exit. |
| Stop Loss | Your active indicators show a breakdown. The specific trigger depends on your strategy (MBX for momentum, RSI for mean reversion, EMA death cross, etc.). |
Fallback Labels
When none of the big signals (entry, re-entry, stop loss, take profit) are active, the tile shows a fallback label instead. For strategies using BX, this is the monthly momentum colour. For Mean Reversion (FVB + RSI), the fallback shows your RSI state instead.
| Label | What it means |
|---|---|
| 1M Green | The sweet spot. Bullish momentum is building. Histogram above zero and growing. This is the one you actually want to see. |
| 1M Dark Green | Still bullish, but momentum is starting to ease off. The histogram is above zero but shrinking. The party may be winding down. |
| 1M Light Red | Mildly bearish. Things are cooling off but haven't fallen apart yet. |
| 1M Dark Red | Strong bearish momentum. Usually triggers a stop loss label instead. |
| RSI Oversold | Mean Reversion only. RSI is below the oversold threshold. Potentially undervalued. |
| RSI Neutral | Mean Reversion only. RSI is between oversold and overbought. No strong signal. |
| RSI Overbought | Mean Reversion only. RSI is above the overbought threshold. Potentially overextended. |
Confirmed vs Pending
Confirmed means the month has closed. It's done. The reading is final and won't change.
Pending means the current month is still in play. These labels can shift before the month ends, so take them with a pinch of salt.
TP Progress
The progress bar on each tile shows how far the current price sits from your take profit target. It uses a logarithmic scale for gains, and a simple percentage for losses (showing the climb needed to get back to break-even, which is always a sobering number).
What a Tile Looks Like
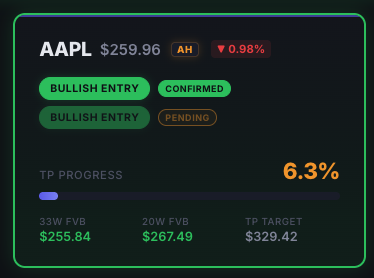
Two-row labels: pending (top) and confirmed (bottom). Both showing Bullish Entry here, but they can differ.
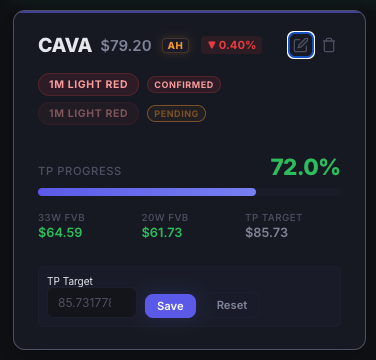
The TP edit dialog. Tap the pencil icon to open, enter your target, hit Save. Reset restores the calculated default.
Using the Dashboard
| Tabs | Stocks Exit tracks your positions against TP targets. Stocks Entry and Crypto focus on accumulation signals. Returns shows your P&L history. |
| Editing TP | This is a big one. Every tile has a default take profit target calculated from the Fair Value Bands, but you can set your own. Tap the pencil icon, enter your number, hit Save. Your personal target is what the progress bar tracks against. Reset puts it back to the calculated default whenever you like. |
| Sorting | The sort button in the header toggles how tiles are ordered. Default is by TP progress. |
| ✎ Badge | Appears on tiles where you've manually overridden the default TP target. |